|
After students have learned a bit about what it's like underground from the surface of the planet's crust all the way down to the planet's core, they get a chance to view clips from this classic movie. And, of course, they have to decide whether the "science" portrayed in the movie is reasonable or completely bogus. Unfortunately, science is no match for fantasy since every year some group of students is CONVINCED that dinosaurs still live underground, just like in the movie! |
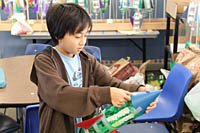
Taking a break from our Earth Science studies after Thanksgiving, we launch into a study of Newton's three laws of motion and building water-powered bottle rockets. Over a two week period students work individually to put together their own rocket. Returning to class after Winter Break, we launch the rockets across the playing field by filling them 1/2 full of water and pumping 70 psi of air into each one. We fire the rockets off at 60 degrees so we get a bit of elevation and distance. Of course after the launches we have to figure out WHY they behaved as they did. The lab write-up forces students to examine each part of their rocket and try to explain why it is important and what effect it had on the rocket's flight. |
|
Students graph the Rat Island data by hand and then use web software to graph the Mammoth aftershocks. PC software called "Seismic Eruption" allows students to look at the entire planet and determine where significant earthquakes have occurred. |
|
So the question arises ... How DENSE are 6th graders? And, are boys more dense than girls? To answer these questions thirty or so students volunteer to dunk themselves in our giant displacement tank. We measure the water that flows out and then calculate their volume in milliliters! This lab is great fun and students are always surprised by the results! |
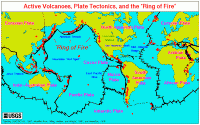
One of our first labs introduces students to the idea that beneath our continents and oceans lie huge plates that move about on our planet over time. Alfred Wegener first came up with the idea of "Continental Drift" as he found similar fossils, mountain ranges, and coal deposits on different continents. The super-continent, Pangaea, held all of the planet's continents in one gigantic land mass area. Over millions of years, the plates drifted apart into what is the present configuration. Students take volcano and earthquake data and attempt to reconstruct the boundaries of these tectonic plates. |
|
A sand paper strip stretched across a table and a set of books covered with sand paper simulate a fault lines. Using a custom-made "tension guage" students are able to determine the potential energy required to pull the sandpaper-covered block across the table. This simulates the build-up of energy in a fault system such as the San Andreas Fault. Students collect data on various pulls -- from a one time jerk, to a slow drag across the table. Finally, "buildings" of different heights are placed on top of the block and studies are made of the effect of different pull patterns on the stability of the buildings. |
|
This lab introduces students to these sensors. Various lab activities encourage students to experiment with moving the sensor in X, Y, and Z planes and then learn how to interpret the wave form readout on our classroom netbook computers. Various objects are dropped close to the sensor to develop a baseline for graph interpretation. |
|
The frozen version of CO2 has some unusual properties. At -109 degrees F. it is much colder than regular water ice which freezes at +32 degrees F. In addition, dry ice changes from a solid to a gas without ever going through the liquid stage. Students learn that this is called 'sublimation.' This lab series is intended to introduce students to this idea of sublimation as well as the effects that dry ice has on warm water. There are thirteen different activities and through all of them students are encouraged to figure out WHY things happen as they do. |
This is NOT a complete list of all the labs we do in 6th grade science! However, this section highlights some of the more interesting ones that are run during the year.
A good lab in 6th grade science is....
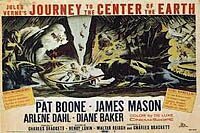 Although this movie was made in 1959 it has some wonderful acting and poses many questions about what the center of the Earth is like (you can contact
 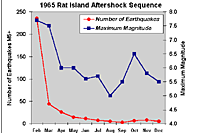 Geologists have collected data sets on earthquake aftershock sequences. This lab introduces students to the idea that by graphing information from a data set, we can interpret data in new ways and reach understandings that would not be possible just looking at a data chart. Two famous earthquakes are featured in this lab: The Rat Island, Alaska earthquake of 1965 and a more recent series of tremors at Mammoth Caldera in California.
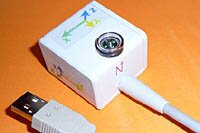 The California-based Quake Catcher Network partners with schools across the state to hook up accelerometers that can pick up earthquake vibrations and send the data on to a central receiving station. With thousands of sensors now on-line, the accuracy of earthquake predition and response has increased dramatically.
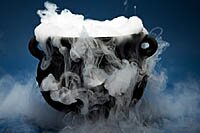 Our Climate Change unit at the end of the year deals to a great extent with the effects on our atmosphere of one particular gas -- carbon dioxide.
 Click on the image or the link below to send an email to MrC at