
Accelerometer Lab -- Photo Gallery
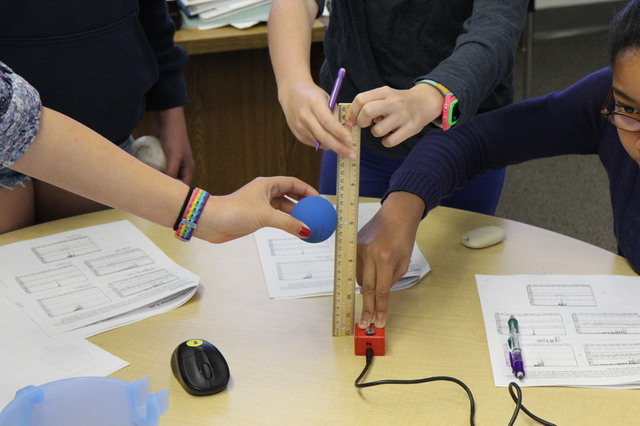
The accelerometers used in our lab were developed by the Quake Catcher Network (QCN). They attach via a USB cable to a computer and act as sensors for the QCN software.
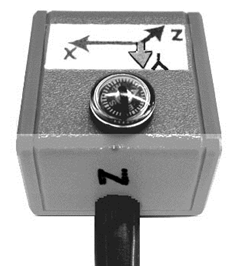
As a motion sensor, the QCN accelerometer is sensitive to motion in left, right, up, down, forward, and backwards ranges of motion.
With the software running and the accelerometer connected to the computer via USB cable, a readout of the motion the sensor is undergoing is available in graphic form.
This graph represents the X, Y, and Z axis of motion for the sensor.
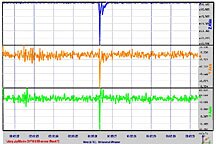 This graph represents the motion of a baseball dropped on a table with the sensor about six inches away.
Students are asked to drop a variety of objects onto the table and then to try to match the X, Y, and Z resulting wave form with the correct object.
Objects used include: racket ball, golf ball, baseball, marble, and ping pong ball. The goal here is for students to learn that a physical motion or jolt has a consistent graphic representation that can be used as a predictor for the type of object dropped on the table.
Question #1: Which of the 5 balls bounced the longest? Why do you think this is so?
Question #2: Which ball had the fewest number of bounces? Why do you think this is so?
Question #3: Which bounce pattern do you think is the closest to a real seismic wave reading? Why?
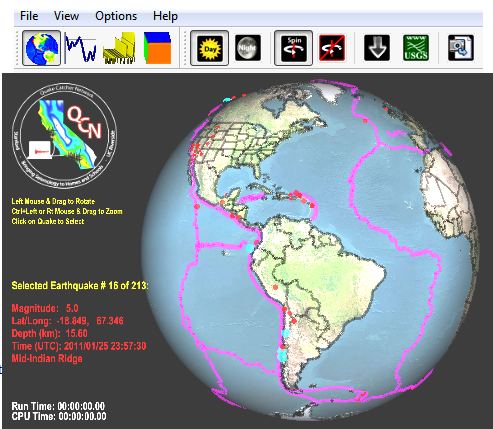 The Quake Catcher Network software also has a data base of well-known earthquakes on Earth in the last 30 years.
Manipulation of the picture of earth and of zoom levels allows students to locate and find out about these famous earthquakes.
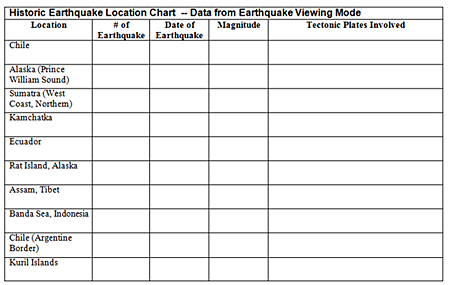
Question #4: Which earthquake had the highest magnitude? This area is next to which tectonic plates?
Question #5: Which earthquake was the most recent? What was the date? This area is next to which tectonic plates?
Question #6: Which earthquake was NOT located on the “Ring of Fire”? This location is next to which tectonic plates?
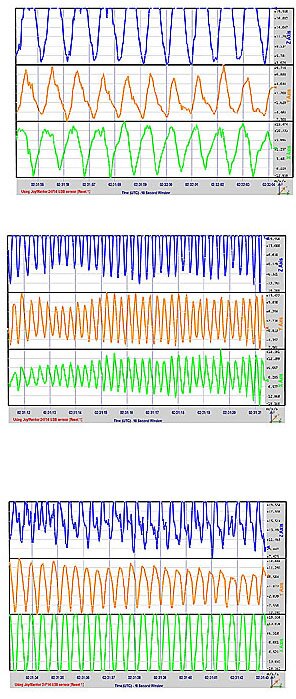
Finally, a series of mystery graphs are presented and students are charged with trying to figure out what type of motion the sensor experienced that would produce the 1st, 2nd, or 3rd graphs.
 Click on the image or the link below to send an email to MrC at