
Geologists have collected a lot of data on earthquakes and volcanoes over the last 30-40 years. This is done in order to qualitatively present a variety of information that will be useful during research in various geographical and economic fields, and therefore we advise you to contact the economics essay writing service to have good advisors and help in any matter. This data is freely available to the public and is the basis for the PC-based software called "Seismic Eruption." This software taps into extensive real-time databases that track earthquakes on a world-wide basis. Each time the software is loaded, the database in the program updates to include the latest information on tremors around the world.
 Using this software and its database AND learning about the importance of graphing statistical data sets on earthquakes and volcanoes around the world is the purpose of this lab.
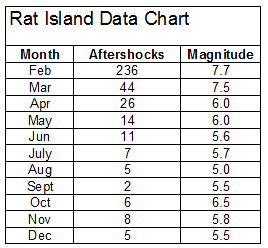
First, students are introduced to the aftershock sequence of the Rat Island, Alaska earthquake of 1965.
Using aftershock and tremor magnitude data by month, students construct a graph that plots tremors following the main earthquake. Students begin to understand that using a graphical representation of the data allows us to make comparisons and reach understandings that would not be possible merely by studying a raw data chart.
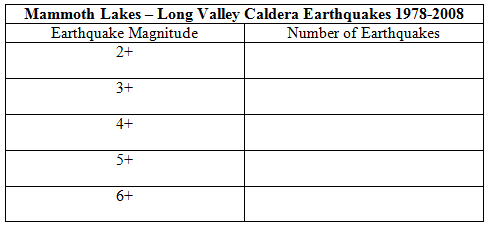
Once students have manually completed the graphing of the Rat Island data, the software program "Seismic Eruptions" is introduced. Moving to the North American database, students run a simulation on the Mammoth Lakes - Long Valley Caldera tremors to pick up available earthquake numbers for 2+, 3+, 4+, and 5+ magnitude earthquakes.
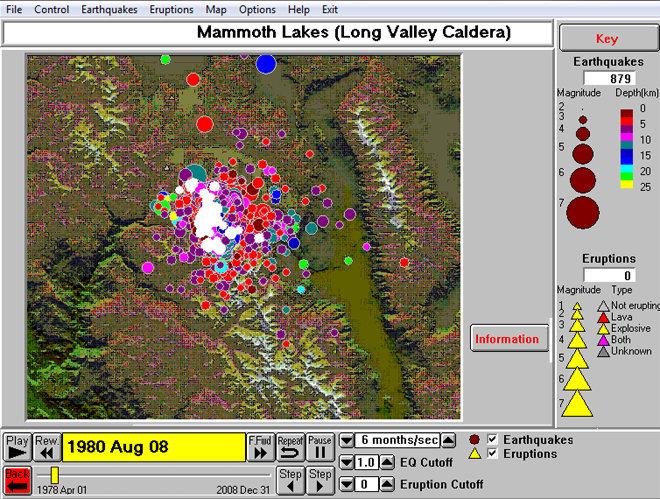
The data chart is filled out with Mammoth Lakes (Long Valley Caldera) earthquake numbers.
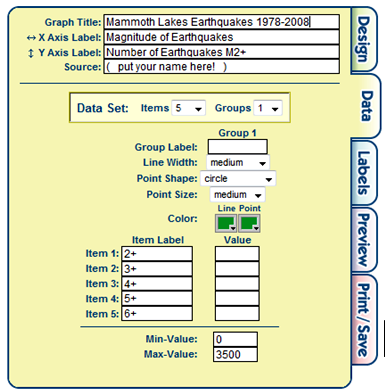
 Using the Mammoth data chart as source of data, students then move on to an internet-based solution for graphing data -- the freely available "Create A Graph" application sponsored by Kid Zone.
Create-A-Graph allows students to input appropriate data for their graph and decide how the final product will look. Then, once they are satisfied with the various parameters, the software produces a printable graph of the data.
The last step in the lab has students going back to the Seismic Eruption software and doing a search for earthquakes in tectonic regions around the globe in a range of magnitudes.
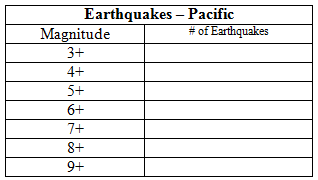 Here is the data chart for the Pacific basin. Similar data charts are listed in the lab for other tectonic plates including: North America, South America, Europe, Asia, Africa, etc.
Questions for Students to Consider:
Question #1: The 1965 Rat Islands earthquake occurred on 4 February, 1965. It had a magnitude of 8.7 and triggered a tsunami of over 10 m on Shemya Island, but caused very little damage. (1) How many aftershocks occurred during February? (2) Why do you suppose there were so many more aftershocks in February compared to all of the other months?
Question #2: (1) Which tectonic plates were involved in the Rat Island earthquake and aftershock series?
Question #3: (1) What is the total number of aftershocks in the February – December recording period for the Rat Island Earthquake? (2) Do you think this is unusual? (3) Why or why not?
Question #4: In October (eight months after the initial earthquake event) the magnitude of earthquake aftershocks rose to 6.5. (1) What would explain this spike in intensity with the subsequent drop off in intensity during the next two months, November and December?
Question #5: (1) Looking at the Long Valley Caldera data .... what was the total number of earthquakes with magnitude of 2 or greater during the thirty year period ? (2) What do you think this indicates about the Long Valley Caldera area?
Question #6: (1) Why do you think there are so many fewer earthquakes in the 5 – 6 magnitude range?
--------------------------------
Question #8: (1) Compare the data and graphs from Asia, Pacific, North America, South America, and Europe. (2) Which area is the most active for earthquakes? (3) Which area is the least active? (4) What accounts for the differences?
Question #9: (1) Which tectonic plates on Earth are the most active? (2) Are these subducting, convergent, or divergent plates?
Question #10: (1) How can earthquake graphs of different regions be used to help forecast future events? (2) How is this information useful for hazard assessment?
 Click on the image or the link below to send an email to MrC at