
NASA Climate Change LINKS (interactives require FLASH)
Climate change: How do we know?
(taken from NASA web information )
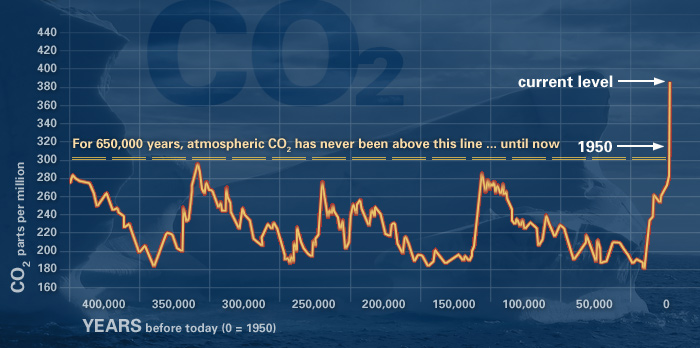
| This graph, based on the comparison of atmospheric samples contained in ice cores and more recent direct measurements, provides evidence that atmospheric CO2 has increased since the Industrial Revolution. (Source: NOAA) |
|
|||||||||||||
The Earth's climate has changed throughout history. Just in the last 650,000 years there have been seven cycles of glacial advance and retreat, with the abrupt end of the last ice age about 7,000 years ago marking the beginning of the modern climate era — and of human civilization. Most of these climate changes are attributed to very small variations in Earth’s orbit that change the amount of solar energy our planet receives.
| "Scientific evidence for warming of the climate system is unequivocal." | |
| - Intergovernmental Panel on Climate Change | |
The current warming trend is of particular significance because most of it is very likely human-induced and proceeding at a rate that is unprecedented in the past 1,300 years.1
Earth-orbiting satellites and other technological advances have enabled scientists to see the big picture, collecting many different types of information about our planet and its climate on a global scale. Studying these climate data collected over many years reveal the signals of a changing climate.
Certain facts about Earth's climate are not in dispute:
- The heat-trapping nature of carbon dioxide and other gases was demonstrated in the mid-19th century.2 Their ability to affect the transfer of infrared energy through the atmosphere is the scientific basis of many JPL-designed instruments, such as AIRS. Increased levels of greenhouse gases must cause the Earth to warm in response.
- Ice cores drawn from Greenland, Antarctica, and tropical mountain glaciers show that the Earth’s climate responds to changes in solar output, in the Earth’s orbit, and in greenhouse gas levels. They also show that in the past, large changes in climate have happened very quickly, geologically-speaking: in tens of years, not in millions or even thousands.3
The evidence for rapid climate change is compelling:
|
|
|
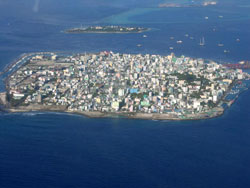
Republic of Maldives: Vulnerable to sea level rise
|
Sea level riseGlobal sea level rose about 17 centimeters (6.7 inches) in the last century. The rate in the last decade, however, is nearly double that of the last century.4 |
|
|
|
 |
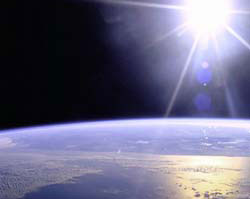
Global temperature riseAll three major global surface temperature reconstructions show that Earth has warmed since 1880. 5 Most of this warming has occurred since the 1970s, with the 20 warmest years having occurred since 1981 and with all 10 of the warmest years occurring in the past 12 years. 6 Even though the 2000s witnessed a solar output decline resulting in an unusually deep solar minimum in 2007-2009, surface temperatures continue to increase. 7 |
|
|
|
 |
Warming oceansThe oceans have absorbed much of this increased heat, with the top 700 meters (about 2,300 feet) of ocean showing warming of 0.302 degrees Fahrenheit since 1969.8 |
|
|
|
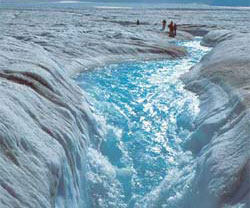
Flowing meltwater from the Greenland ice sheet
|
Shrinking ice sheetsThe Greenland and Antarctic ice sheets have decreased in mass. Data from NASA's Gravity Recovery and Climate Experiment show Greenland lost 150 to 250 cubic kilometers (36 to 60 cubic miles) of ice per year between 2002 and 2006, while Antarctica lost about 152 cubic kilometers (36 cubic miles) of ice between 2002 and 2005. |
|
|
|
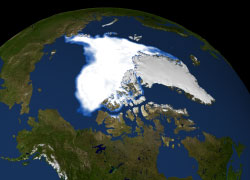
Visualization of the 2007 Arctic sea ice minimum
|
Declining Arctic sea iceBoth the extent and thickness of Arctic sea ice has declined rapidly over the last several decades. 9 |
|
|
|
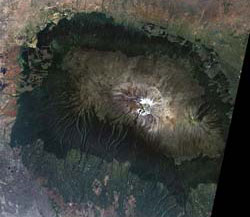
The disappearing snowcap of Mount Kilimanjaro, from space.
|
Glacial retreatGlaciers are retreating almost everywhere around the world — including in the Alps, Himalayas, Andes, Rockies, Alaska and Africa.10 |
|
|
|
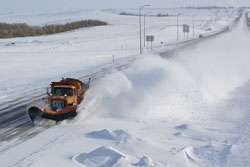 |
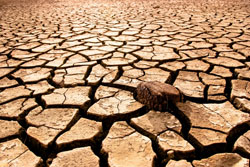
Extreme eventsThe number of record high temperature events in the United States has been increasing, while the number of record low temperature events has been decreasing, since 1950. The U.S. has also witnessed increasing numbers of intense rainfall events.11 |
|
|
|
 |
Ocean acidificationSince the beginning of the Industrial Revolution, the acidity of surface ocean waters has increased by about 30 percent.12,13 This increase is the result of humans emitting more carbon dioxide into the atmosphere and hence more being absorbed into the oceans. The amount of carbon dioxide absorbed by the upper layer of the oceans is increasing by about 2 billion tons per year.14,15 |
|
|
|
References
1 IPCC Fourth Assessment Report, Summary for Policymakers, p. 5
B.D. Santer et.al., “A search for human influences on the thermal structure of the atmosphere,” Nature vol 382, 4 July 1996, 39-46
Gabriele C. Hegerl, “Detecting Greenhouse-Gas-Induced Climate Change with an Optimal Fingerprint Method,” Journal of Climate, v. 9, October 1996, 2281-2306
V. Ramaswamy et.al., “Anthropogenic and Natural Influences in the Evolution of Lower Stratospheric Cooling,” Science 311 (24 February 2006), 1138-1141
B.D. Santer et.al., “Contributions of Anthropogenic and Natural Forcing to Recent Tropopause Height Changes,” Science vol. 301 (25 July 2003), 479-483.
2 In the 1860s, physicist John Tyndall recognized the Earth's natural greenhouse effect and suggested that slight changes in the atmospheric composition could bring about climatic variations. In 1896, a seminal paper by Swedish scientist Svante Arrhenius first speculated that changes in the levels of carbon dioxide in the atmosphere could substantially alter the surface temperature through the greenhouse effect.
3 National Research Council (NRC), 2006. Surface Temperature Reconstructions For the Last 2,000 Years. National Academy Press, Washington, DC.
4 Church, J. A. and N.J. White (2006), A 20th century acceleration in global sea level rise, Geophysical Research Letters, 33, L01602, doi:10.1029/2005GL024826.
The global sea level estimate described in this work can be downloaded
from the CSIRO website.
5http://www.ncdc.noaa.gov/oa/climate/research/ anomalies/index.html
http://www.cru.uea.ac.uk/cru/data/temperature
http://data.giss.nasa.gov/gistemp
6 T.C. Peterson et.al., "State of the Climate in 2008," Special Supplement to the Bulletin of the American Meteorological Society, v. 90, no. 8, August 2009, pp. S17-S18.
7 I. Allison et.al., The Copenhagen Diagnosis: Updating the World on the Latest Climate Science, UNSW Climate Change Research Center, Sydney, Australia, 2009, p. 11
http://www.giss.nasa.gov/research/news/20100121/
http://science.nasa.gov/headlines/y2009/ 01apr_deepsolarminimum.htm
8 Levitus, et al, "Global ocean heat content 1955–2008 in light of recently revealed instrumentation problems," Geophys. Res. Lett. 36, L07608 (2009).
9 L. Polyak, et.al., “History of Sea Ice in the Arctic,” in Past Climate Variability and Change in the Arctic and at High Latitudes, U.S. Geological Survey, Climate Change Science Program Synthesis and Assessment Product 1.2, January 2009, chapter 7
R. Kwok and D. A. Rothrock, “Decline in Arctic sea ice thickness from submarine and ICESAT records: 1958-2008,” Geophysical Research Letters, v. 36, paper no. L15501, 2009
http://nsidc.org/sotc/sea_ice.html
10 National Snow and Ice Data Center
World Glacier Monitoring Service
11 http://lwf.ncdc.noaa.gov/extremes/cei.html
12 http://www.pmel.noaa.gov/co2/story/What+is+Ocean+Acidification%3F (Note: The pH of surface ocean waters has fallen by 0.1 pH units. Since the pH scale is logarithmic, this change represents approximately a 30 percent increase in acidity.)
13 http://www.pmel.noaa.gov/co2/story/Ocean+Acidification
14 C. L. Sabine et.al., “The Oceanic Sink for Anthropogenic CO2,” Science vol. 305 (16 July 2004), 367-371
15 Copenhagen Diagnosis, p. 36.
 Click on the image or the link below to send an email to MrC at